
Retail Sales Analytics Dashboard
A selected portfolio piece by Rohail Khan, highlighting the idea, approach, execution, and outcome behind the work.
Project Overview
The Retail Sales Analytics Dashboard is a complete data analytics web application developed to help businesses transform raw retail sales files into meaningful and actionable insights.
Users can upload sales datasets in CSV or Excel format. The system automatically validates column names, supports alternative column naming formats, removes duplicate and invalid records, cleans missing values, and calculates total sales for every transaction.
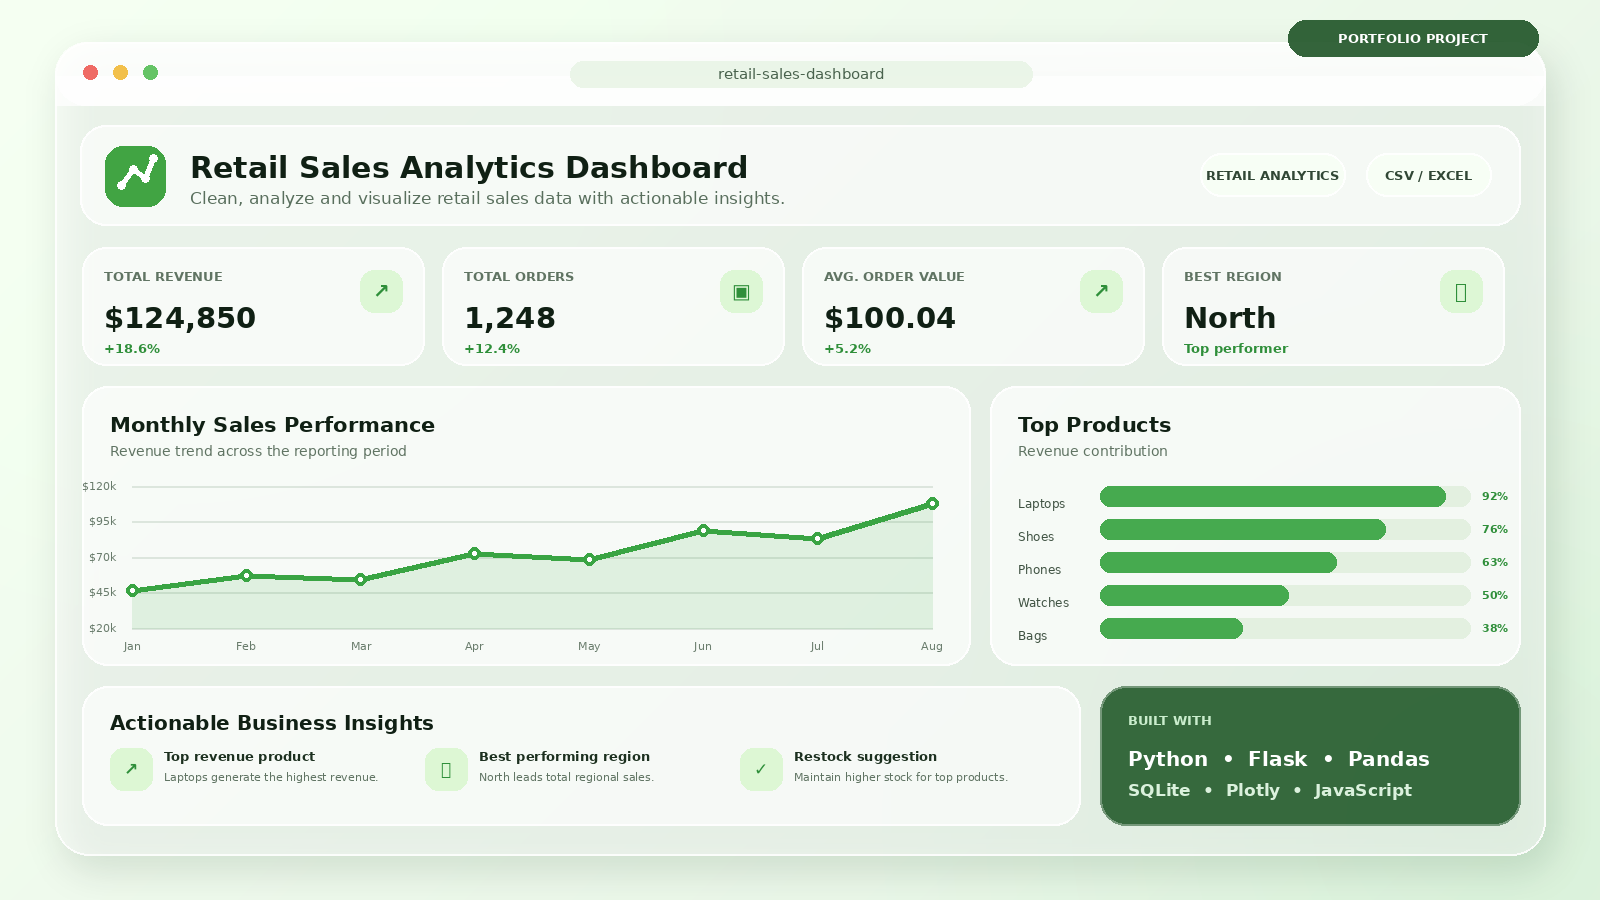
After processing the uploaded dataset, the application generates important business KPIs, including total revenue, total orders, total quantity sold, average order value, best-selling product, highest-performing category, and best-performing region.
The dashboard also provides business insights such as the top and lowest revenue-generating products, strongest and weakest sales regions, best-performing sales month, and inventory restocking suggestions.
Interactive Plotly charts are used to visualize monthly sales trends, top products, category performance, and regional sales distribution. Each analyzed report is stored in an SQLite database, allowing users to view previous reports, inspect cleaned sales records, download cleaned CSV files, or delete saved reports.
The interface features a responsive glass-style dashboard design with a modern light and dark green color theme, making the application suitable for both desktop and mobile devices.
Technologies: Python, Flask, Pandas, SQLite, Plotly, HTML, CSS and JavaScript.